Analyze charts. Create powerful strategies and indicators in C# and VB. Place automated or manual trades and more!
Latest Update:
MultiCharts .NET is now compatible with the S5 Jigsaw Trading Tools!
Get MultiCharts Special Edition for FREE!
No Monthly Platform Fees!
- Free ATM Strategies
- Free 10 Levels Deep – Bid/Ask Prices
- Free Automated Trading
- Free Market Replay – Tick-by-Tick
- Free Chart Trader
- Free Server-Side OCO orders
- Free Custom Indicator Development
Features:
MultiCharts .NET including trading capabilities (chart, DOM, drag-and-drop strategies and fully automated), best charting in the industry, advanced strategy development capabilities in C# and Visual Basic, integration with Visual Studio, high-precision tick-by-tick strategy and portfolio backtesting, extremely fast optimization and more…
Volume Analysis
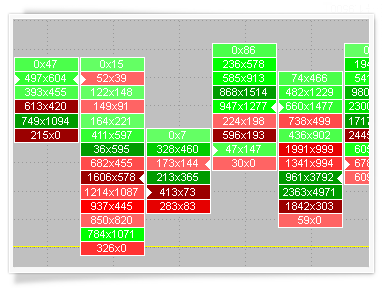
Importance of volume analysis cannot be underestimated. Paying attention to volume can be the crucial difference in understanding how the market will move. Volume Profile, Volume Delta, Cumulative Delta and pre-built Volume Indicators are designed to help you understand not only how much was bought, but at which prices activity was the highest, and whether there are more buyers than sellers.
Automated Trading
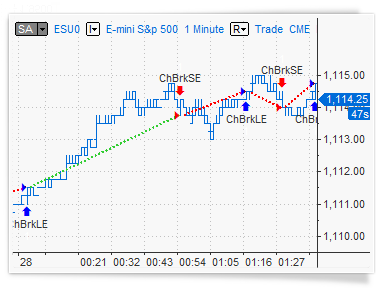
Even with a winning strategy, just a short delay in order execution can make all the difference. After developing a strategy, the next step is to actually send the orders. The key advantage of automated trading is that it can send orders a lot faster than a human being. This can give you an advantage over the competition!
One-click trading from Chart & DOM
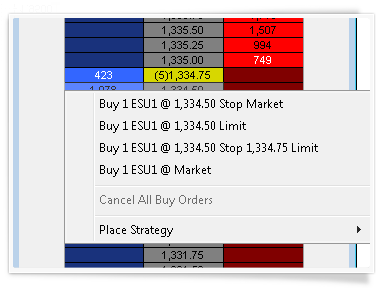
Take control of your trading and act quickly when you see an opportunity to place orders in seconds through our Chart Trading & DOM. It’s simple and intuitive, you can click or drag-and-drop orders onto your chart. MultiCharts features many tools to help you achieve your goals of Chart Trading, Trade Bar, Order and Position Tracker, Depth of Market, Automation of Entries and Exits, and Symbol Mapping.
Hundreds of Strategies & Indicators
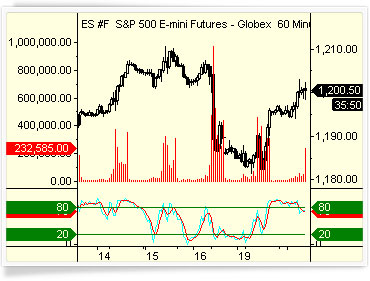
We have collected the most popular indicators and strategies we could find, and included them in the platform for free, so you don’t have to look for them. All you need to do is right-click on the chart, and they are at your fingertips. Remember, you can always add more, or write your own in addition to existing ones.
Replay Market Data
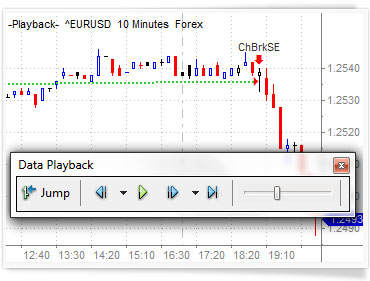
Trading the markets is all about predicting where the price will go next. A good way to practice is to apply your price-predicting skills to historical data. Market Data Replay allows you start playback at any point in the past, speed up or slow down replay speed, and even playback several instruments at once.
Request your MultiCharts .NET Free Trial:
[ninja_forms_display_form id=”69″]


